Launch of ROUTES Dashboard
How do you feel about snakes on your plane?
Or the tusks of a hundred dead elephants in the cargo hold below you?
It has become increasingly common for traffickers to use ordinary commercial routes to illegally move live animals and wildlife products. When we began our work on illicit ivory supply chains back in 2014, air trafficking was a small minority of all large-scale seizures, i.e. those seizures that are indicative of organized crime involvement.
However, as awareness of ivory trafficking increased, that trend began to change. In 2015, Australian officials seized 110kg of ivory in an air cargo shipment (roughly equivalent to 14 elephants); one year later, South Sudanese officials seized a staggering 1.28 tons of ivory (about 168 elephants) in another air cargo shipment. And it is not just ivory: far too many species are under attack by unscrupulous networks of people driven by the promise of enormous profits with little risk from enforcement. By 2019, we had counted hundreds more seizures of ivory, as well as hundreds of seizures of rhino horn in checked baggage, pangolin scales in air freight, turtles in checked baggage, Guyanese finches in the sleeves of passengers, European eels packed in checked baggage by the tens of thousands, and tiger cubs sedated and hidden in suitcases.
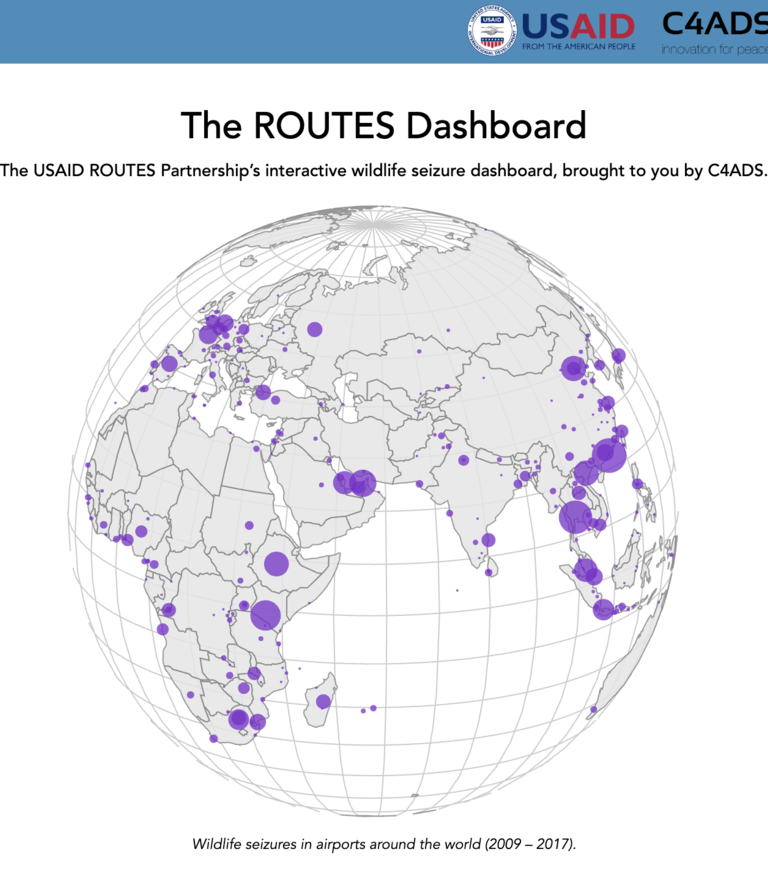
To help combat wildlife trafficking by air, C4ADS, as part of the USAID Reducing Opportunities for Unlawful Transport of Endangered Species (ROUTES) Partnership, is proud to launch the first-ever data dashboard on wildlife trafficking in the air transport sector. The ROUTES Dashboard relies on the C4ADS Air Seizure Database, which currently includes 1,379 instances of air trafficking in more than 130 countries representing over 69 tons of smuggled wildlife products.
The ROUTES Dashboard is publicly available and provides in-depth and customizable analysis of the trafficking trends, routes, and methods associated with wildlife trafficking seizures in airports. The data and analysis it provides can be used by transport companies, enforcement personnel, government agencies, and other stakeholders to uncover actionable insights that can help strengthen counter-wildlife trafficking policies in the air transport sector.
Dive Into the Data! #
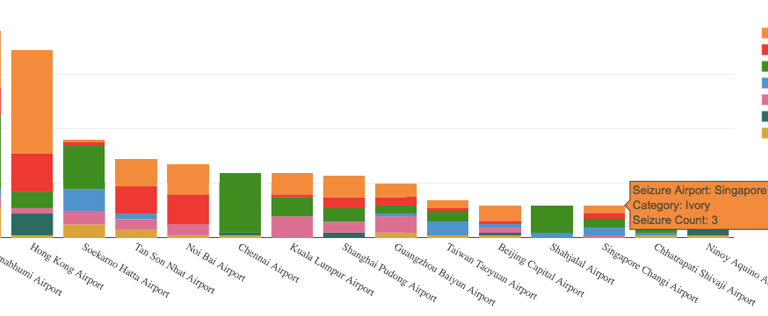
Examine overall seizure trends. The chart below reveals that the top five airports for wildlife trafficking by seizure count are located in East Asia.
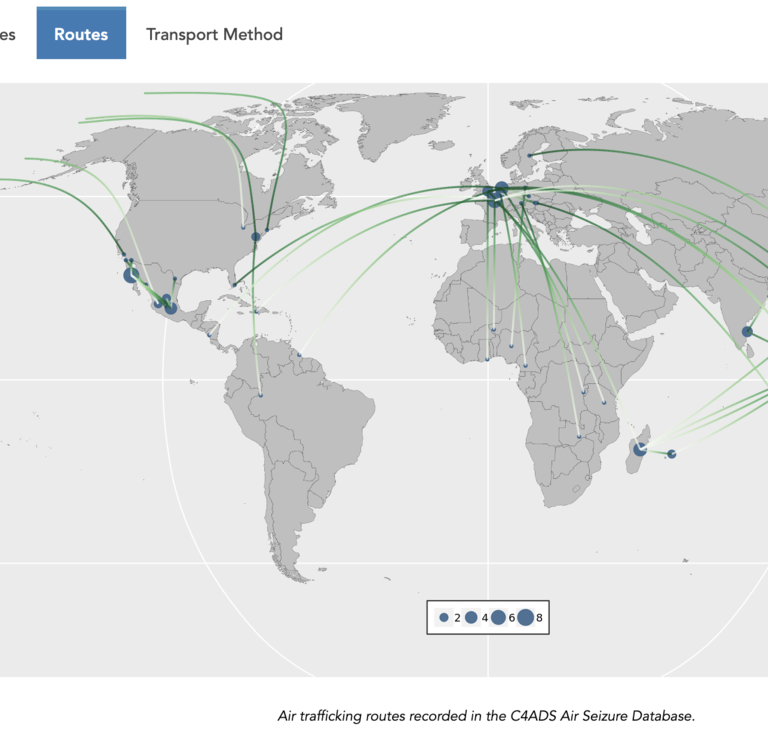
Filter the data by species. Break down your search by a range of further indicators such as species, trafficking method, and region. The routes map below shows global reptile trafficking moved only in air freight.
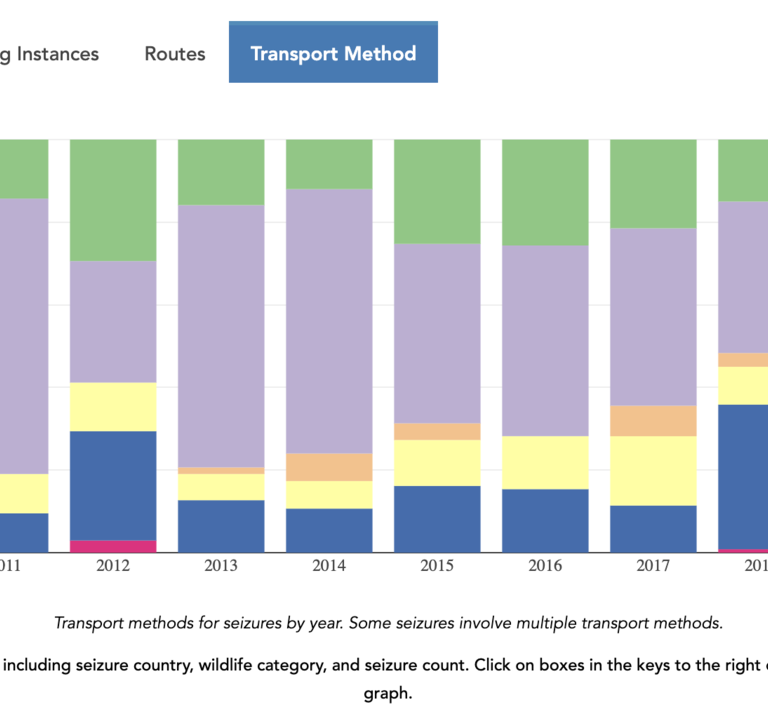
Generate detailed graphics. After filtering the data, select one of several tabs to view detailed graphics. The chart below highlights trafficking trends for all species in Asia.
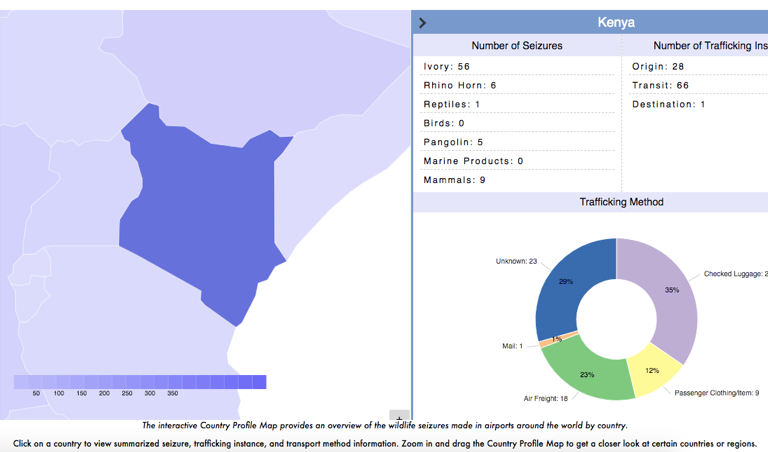
Country Profile Map #
The Dashboard includes a Country Profile Map, allowing users to access available information on wildlife trafficking by air in each country.
Kenya, for example, emerges in the data both as a source and a transit country. Kenya’s prominence is primarily due to two factors: Jomo Kenyatta Airport’s role as a major hub between flight routes originating in Africa and destined for the Middle East and Asia, and Kenyan enforcement’s awareness of the prevalence of wildlife trafficking activity in their airports. The high volume of wildlife passing through the airport combined with enforcement’s heightened ability to stop wildlife trafficking instances in the airport leads to both the country’s high seizure count and the fairly diverse array of wildlife seized there.
ROUTE Risk Tool #
Finally, the Dashboard’s Route Risk Tool can be used to produce a dynamic risk estimate for different airline routes. This can provide predictive insights for policymakers, allowing airlines, governments, and other stakeholders to better direct scarce enforcement resources.
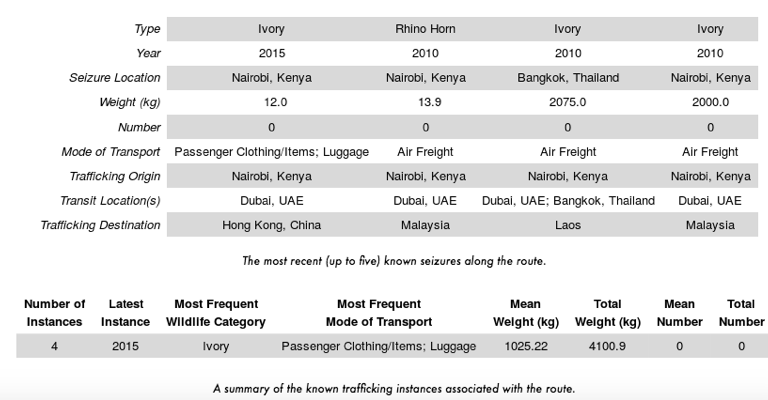
Although the tool is still in development, you can choose from any pair of flight routes in the C4ADS Air Seizure Database to view a list of wildlife seizures along that route.
For example, the Route Risk Tool generated the below tables for the route between Nairobi and Dubai. At least four seizures have occurred along this flight route, most of which were carried by air freight. None of these trafficking instances, however, were going to stay in Dubai–all used the UAE as a transfer country, with at least four other countries (China, Malaysia, Thailand, and Laos) listed as intended destinations.
C4ADS is proud to partner with ROUTES to analyze wildlife trafficking in the air transport sector. The Dashboard represents the ROUTES Partnership’s latest effort to put actionable information in the hands of governments and the air industry. In 2018, we released In Plane Sight, a nearly decade-long analysis of wildlife trafficking seizures at airports and in airlines worldwide. In Plane Sight was a follow-up to our 2017 report, Flying Under the Radar, which marked the first-ever analysis of wildlife trafficking in the aviation industry and showcased the widespread exploitation of transport supply chains by criminal networks engaged in wildlife trafficking.